Introduction 

In today’s competitive business landscape, effective outreach is crucial for growth. Whether you’re a startup looking to build your customer base or an established enterprise seeking to expand market share, understanding how to track and optimize your outreach funnel performance can make the difference between stagnation and success. Businesses that implement robust tracking and optimization strategies see conversion rates improve by up to 300%, according to a recent HubSpot study. Let’s dive into how you can transform your outreach funnel into a high-performing engine that consistently delivers results.

Understanding the Outreach Funnel

The outreach funnel represents the journey prospects take from first contact to becoming customers. Unlike traditional marketing funnels that begin with awareness, outreach funnels focus specifically on direct communication efforts—whether through email, social media, phone calls, or in-person meetings. According to research from Salesforce, companies that effectively manage their outreach funnel experience 23% higher revenue growth compared to those without structured approaches.

A typical outreach funnel consists of several stages: prospecting, initial contact, follow-up engagement, objection handling, and conversion. Each stage requires different metrics and optimization strategies to maximize performance. By understanding these stages and implementing proper tracking mechanisms, you can identify bottlenecks and opportunities throughout your outreach process.

Essential Metrics for Tracking Outreach Funnel Performance

To optimize what you can’t measure is impossible. Successful outreach funnel optimization begins with tracking the right metrics at each stage. According to data from Gartner, organizations that use data-driven decision making in their sales processes are 58% more likely to exceed their revenue goals.

Start by measuring volume metrics like the number of prospects identified, outreach attempts made, and responses received. These provide insight into your team’s activity levels. Next, track engagement metrics such as response rates, meeting-booking rates, and content engagement. These reveal how effectively your message resonates with prospects.

Conversion metrics deserve special attention—monitor qualification-to-opportunity ratios, opportunity-to-close rates, and average deal sizes. These metrics illuminate your funnel’s bottom-line effectiveness. Finally, track efficiency metrics including average sales cycle length, cost per acquisition, and return on outreach investment. When analyzed together, these metrics provide a comprehensive view of your outreach funnel performance.

Implementing Technology Solutions for Better Tracking

Modern outreach funnel tracking requires robust technology solutions. CRM systems serve as the foundation, capturing prospect interactions and progress through the funnel. Email tracking tools provide visibility into open rates, click-through rates, and engagement patterns. Social selling platforms monitor interactions across social channels, while call tracking software measures phone conversation effectiveness.

Research from McKinsey shows that companies using integrated tech stacks for outreach tracking achieve 40% higher sales productivity compared to those using disconnected tools. Integration is key—your systems should talk to each other, providing a unified view of prospect journeys across channels and touchpoints.

Diagnosing Common Outreach Funnel Problems

When tracking reveals underperformance, diagnosing specific issues becomes critical. Low response rates often indicate targeting problems or weak value propositions. High initial engagement but poor follow-through suggests qualification issues or ineffective follow-up processes. Long sales cycles may point to complex decision-making processes or inadequate objection handling.

According to a study published in the Harvard Business Review, companies that follow up within five minutes of receiving an inquiry are 100 times more likely to connect with a prospect than those that wait 30 minutes. This highlights how timing-related issues can dramatically impact funnel performance. Use your tracking data to identify where specifically your funnel is underperforming, then target your optimization efforts accordingly.

Optimization Strategies That Drive Results

Once you’ve identified problem areas, implement targeted optimization strategies. For prospecting stages, refine your ideal customer profile using data from your most successful conversions. This improves targeting precision and increases qualification rates. For initial outreach, A/B test different messages, subject lines, and outreach sequences to identify what resonates best with your audience.

Follow-up optimization requires structured cadences with varying touchpoints and channels. Research from Rain Group indicates that 80% of sales require at least five follow-ups, yet 44% of salespeople give up after just one attempt. Implement systematic follow-up processes and track which patterns yield the best results.

For later-stage optimization, analyze successful deals to identify common objections and develop effective handling strategies. Train team members on these approaches and track improvement in conversion rates after implementation. Throughout the funnel, personalization drives better results—prospects who receive personalized outreach are 75% more likely to respond positively, according to research by SalesHacker.

Leveraging Analytics for Continuous Improvement

Outreach funnel optimization is never complete. Implement a continuous improvement cycle that leverages analytics to drive ongoing refinement. Set up regular review sessions to analyze funnel metrics, identify trends, and adjust strategies accordingly. Use cohort analysis to compare performance across different time periods, campaigns, or team members.

Predictive analytics can take your optimization efforts to the next level by identifying which prospects are most likely to convert based on historical patterns. According to Forrester Research, predictive analytics users are 2.9 times more likely to achieve high growth rates compared to non-users. By embracing a data-driven approach to continuous improvement, you can ensure your outreach funnel becomes increasingly efficient over time.

Conclusion

Tracking and optimizing your outreach funnel performance requires commitment to measurement, analysis, and ongoing refinement. By implementing robust tracking systems, diagnosing specific issues, and applying targeted optimization strategies, you can transform your outreach efforts from guesswork into a scientific process that consistently delivers results. Remember that outreach funnel optimization is a journey, not a destination—the most successful organizations constantly refine their approach based on new data and market conditions.

How has your experience been with tracking and optimizing your outreach funnel performance? We’d love to hear your thoughts, challenges, and successes in the comments below. If you found this article helpful, please share it with your network on social media to help others improve their outreach results too!

FAQ

1. How do I know which outreach funnel metrics matter most for my business? 

Focus on conversion rates between stages and overall ROI. Different businesses need different emphasis—B2B should track meeting conversions while ecommerce might prioritize email click-through rates.

2. How often should I analyze my funnel performance? 

Monthly for comprehensive reviews, weekly for key metrics, and daily for active campaign monitoring.

3. What’s a good response rate benchmark?

Industry averages range from 5-30%; aim for 10% initially, then improve incrementally.

4. Can I optimize my funnel without expensive software? 

Yes—start with spreadsheets and free trials, investing in specialized tools only after establishing basic tracking processes.
Leave a Reply

Your email address will not be published. Required fields are marked *

Start Your Growth Project

Tell us about your business, your goals, and where you are stuck. We will respond.

Zero to 18K: Building Petal's Community-First Instagram

From a brand nobody had discovered to a community people were recommending to their friends.

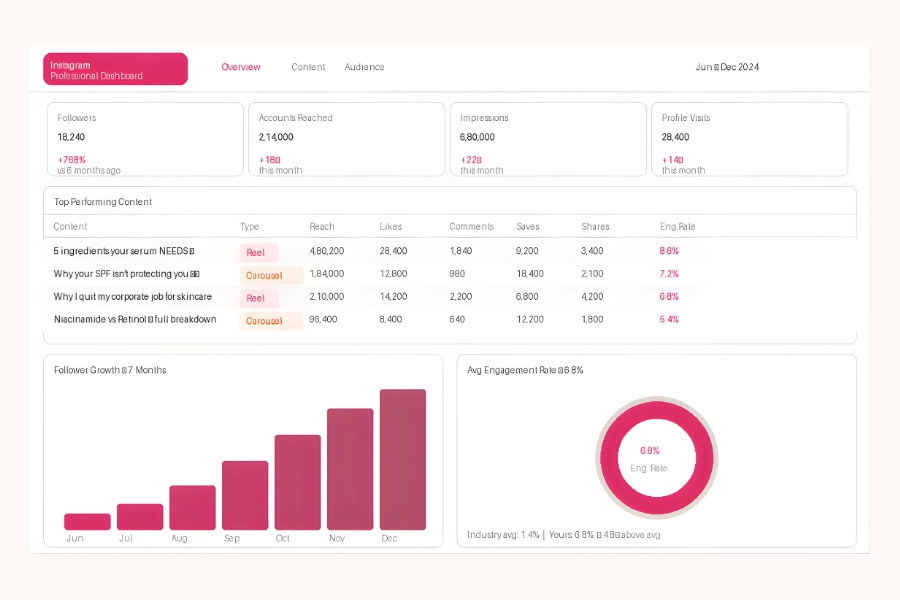
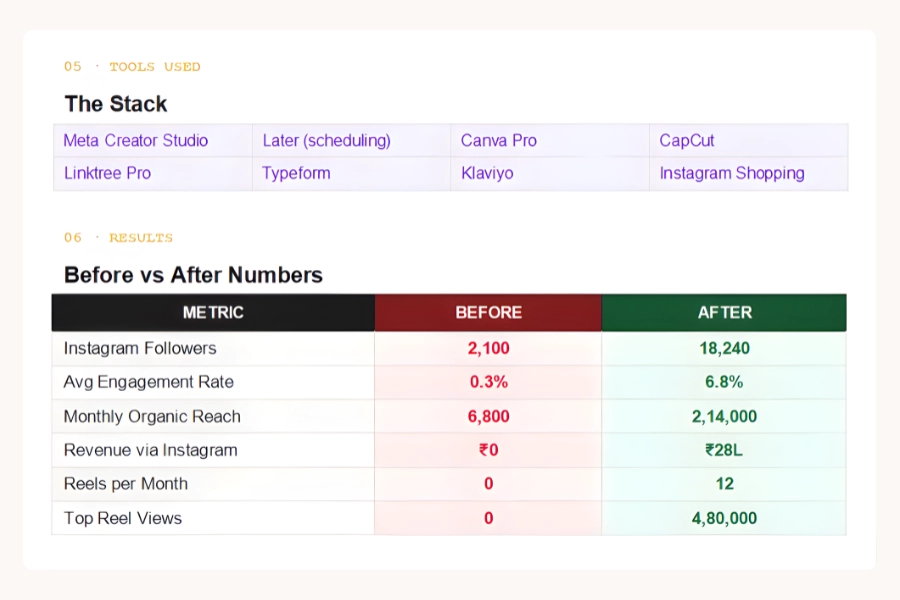
18.2K

INSTAGRAM FOLLOWERS

6.8%

AVG ENGAGEMENT RATE

₹28L

REVENUE VIA IG SHOPPING

7 Months

TIMELINE

01 · CLIENT OVERVIEW

Who We Worked With

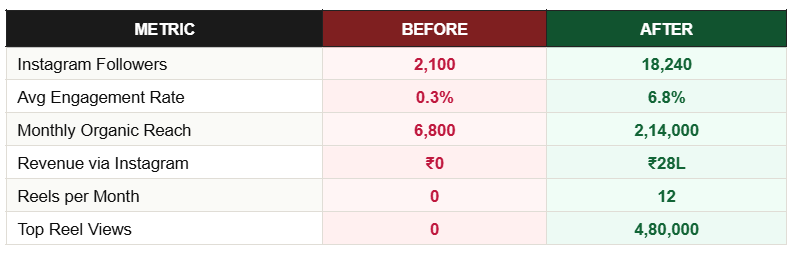
Petal is an indie beauty startup — two founders, clean ingredients positioning, genuinely excellent products, and essentially no marketing. They had 2,100 followers when we started, near-zero reach, and a founder posting inconsistently whenever she found time. The products had earned 4.8-star reviews but nobody outside their immediate circle had heard of the brand.

02 · PROBLEM STATEMENT

What Wasn't Working

The brand had no content identity, no posting system, and no strategy connecting social media to sales. What posts did exist were flat-lay product images that looked identical to every other indie beauty brand. The founder had no time, no brief, and no creative framework. There was no link-in-bio strategy and Instagram Shopping wasn't set up.

03 · STRATEGY

How We Thought About It

We repositioned Petal from 'product showcase' to 'ingredient intelligence meets real-woman narrative.' The insight: conscious beauty buyers research before they buy. They want to understand what's in the bottle, why it works, and whether the brand is run by people who actually care. Education-first content builds that trust without ever selling. We used a 3-pillar system: Ingredient Intel, Real Skin Stories, and The Formula.

Beauty is a high-trust, high-consideration category. A follower who saves your 'Why niacinamide at 5% works' post has spent 40 seconds thinking about your product. That's 40 seconds of unprompted consideration you didn't pay for. Saves are the highest-intent action on Instagram and extend organic reach algorithmically. Teaching is the most efficient form of selling.

04 · EXECUTION

Step-by-Step Breakdown

05 · TOOLS USED

The Stack

06 · RESULTS

Before vs After Numbers

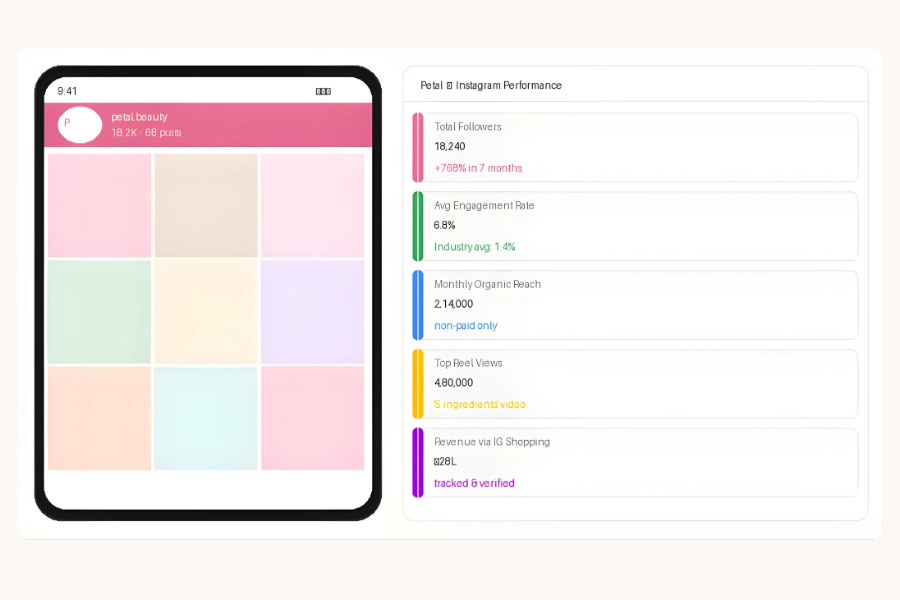
Petal Results

◈ Portfolio Design Directions (For Behance / Designer)

07 · KEY TAKEAWAYS

What Made It Work

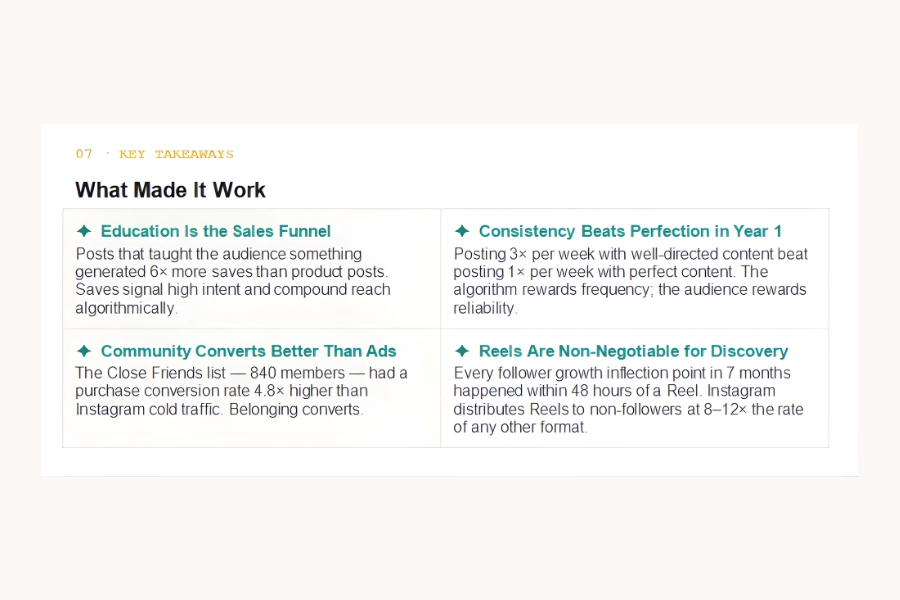
Posts that taught the audience something generated 6× more saves than product posts. Saves signal high intent and compound reach algorithmically.

Posting 3× per week with well-directed content beat posting 1× per week with perfect content. The algorithm rewards frequency; the audience rewards reliability.

The Close Friends list — 840 members — had a purchase conversion rate 4.8× higher than Instagram cold traffic. Belonging converts.

Every follower growth inflection point in 7 months happened within 48 hours of a Reel. Instagram distributes Reels to non-followers at 8–12× the rate of any other format.

Screenshots

Want Results Like These?

Want to build a social media presence that earns trust, builds community, and converts?

The ₹1.8Cr Funnel Audit: How Forge Stopped Leaking Revenue

The traffic was never the problem. The funnel was the problem — and it was haemorrhaging at every single stage.

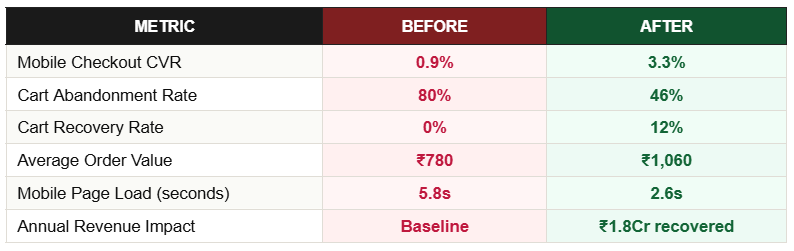
₹1.8Cr

ANNUAL REVENUE RECOVERED

+280%

CHECKOUT CONVERSION

−42%

CART ABANDONMENT

6 Weeks

TIMELINE

01 · CLIENT OVERVIEW

Who We Worked With

Forge is a funded D2C nutrition brand — protein supplements, health snacks, electrolyte drinks — spending ₹5Cr/month on paid acquisition. Strong brand awareness, high repeat purchase rate, but conversion benchmarks consistently 35–40% below category averages. The CEO knew there was leakage — just not where.

02 · PROBLEM STATEMENT

What Wasn't Working

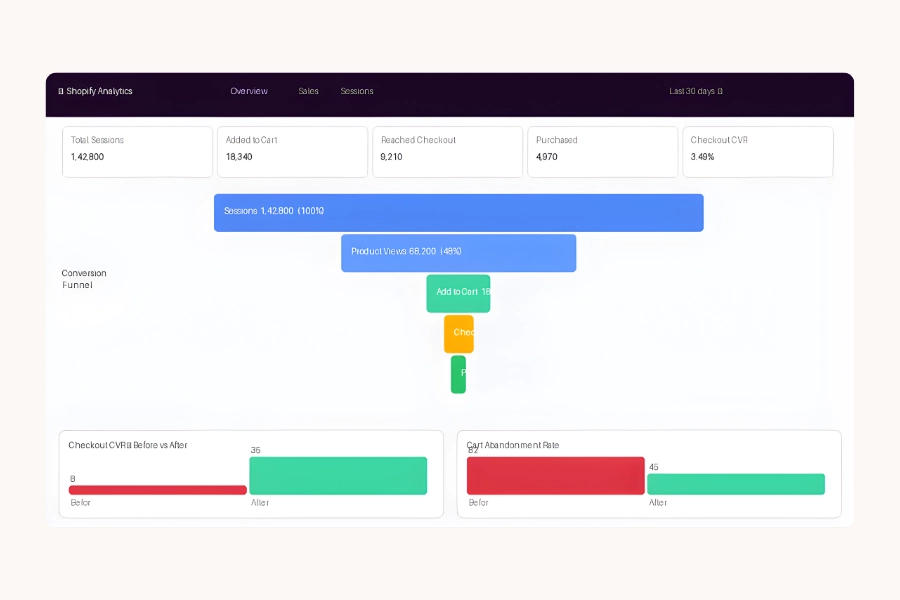
A ₹5Cr/month traffic budget was feeding a funnel that converted at 0.9% on mobile — against an industry average of 2.4%. The mobile checkout had 11 form fields. There was no cart recovery sequence. Product pages were beautiful but led with ingredient lists rather than outcomes. The brand had never run a structured CRO audit.

03 · STRATEGY

How We Thought About It

We ran a complete CRO audit before touching a single element: heatmaps to find where attention was lost, session recordings to find where users hesitated, and funnel analytics to quantify drop-off at each stage. Only after building the full picture did we prioritise fixes by impact-to-effort ratio. High-impact, low-effort changes first. A/B tests on every significant change before full rollout.

At ₹5Cr monthly ad spend, even a 0.5% improvement in checkout conversion rate generates significant incremental monthly revenue — with no additional acquisition cost. Funnel optimisation at scale has the highest ROI of any marketing activity. The traffic is already paid for.

04 · EXECUTION

Step-by-Step Breakdown

05 · TOOLS USED

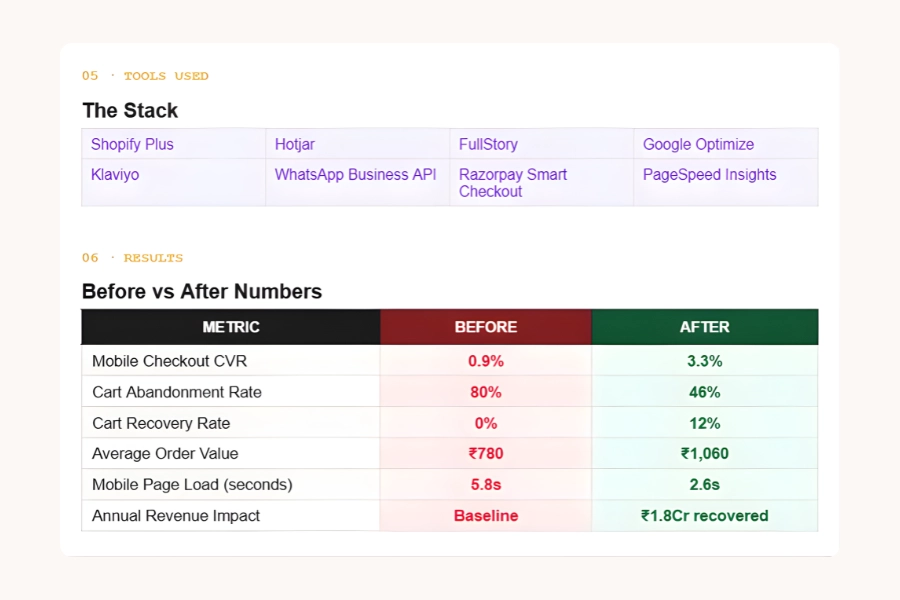
The Stack

06 · RESULTS

Before vs After Numbers

Forge Results

◈ Portfolio Design Directions (For Behance / Designer)

07 · KEY TAKEAWAYS

What Made It Work

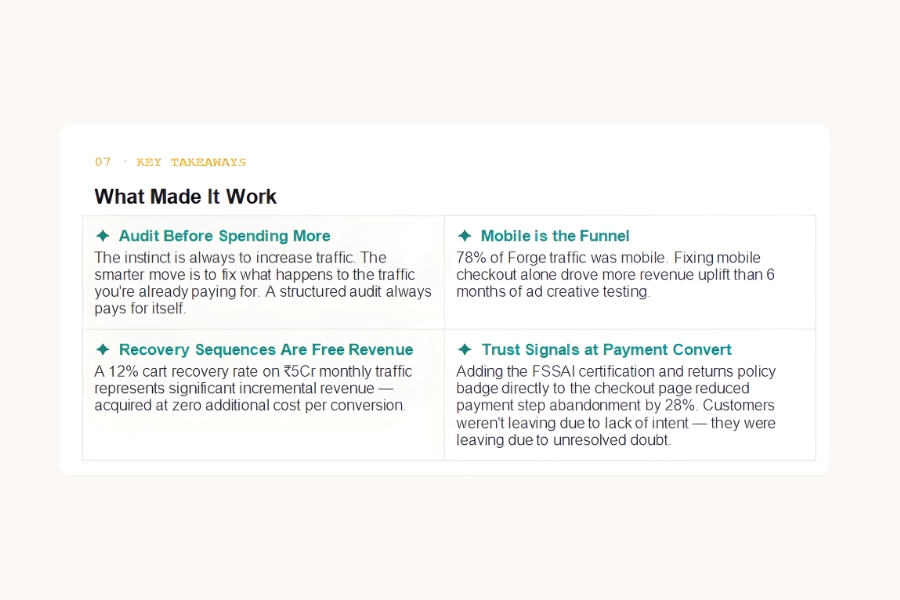
The instinct is always to increase traffic. The smarter move is to fix what happens to the traffic you're already paying for. A structured audit always pays for itself.

78% of Forge traffic was mobile. Fixing mobile checkout alone drove more revenue uplift than 6 months of ad creative testing.

A 12% cart recovery rate on ₹5Cr monthly traffic represents significant incremental revenue — acquired at zero additional cost per conversion.

Adding the FSSAI certification and returns policy badge directly to the checkout page reduced payment step abandonment by 28%. Customers weren't leaving due to lack of intent — they were leaving due to unresolved doubt.

Screenshots

Want Results Like These?

Want us to audit your funnel and find the revenue that's already in your traffic?

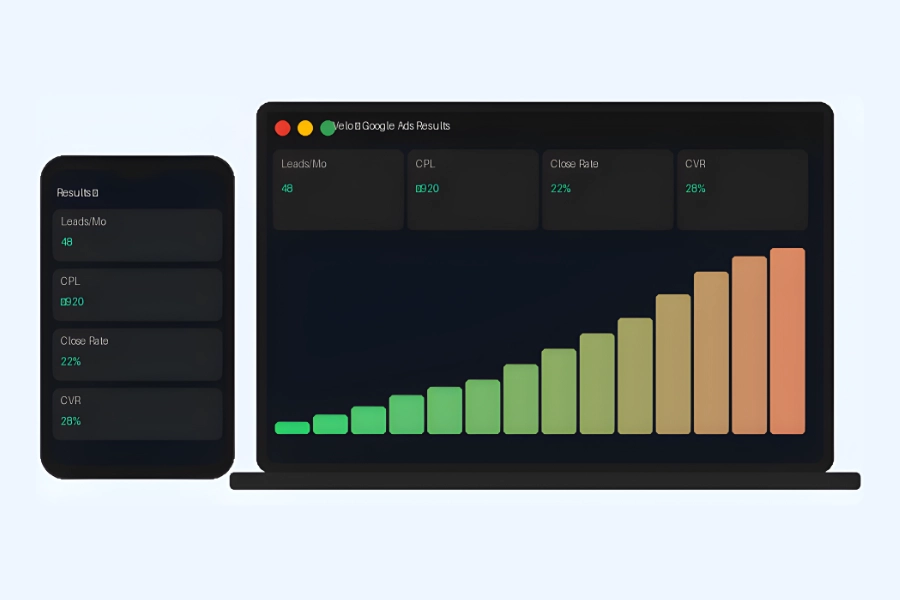
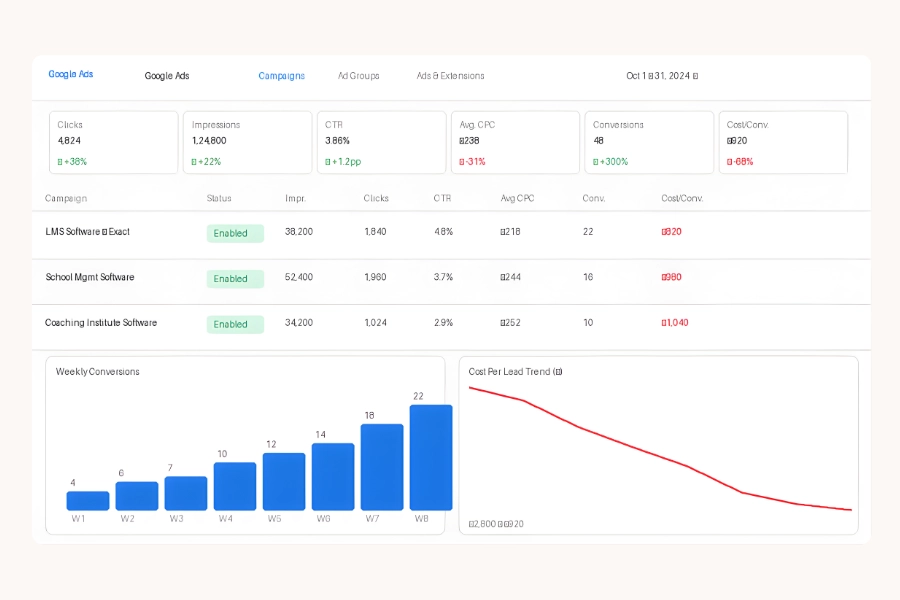
The B2B Lead Machine: 48 Qualified Leads/Month for Velo

We stopped paying for traffic from students. We started paying for pipeline from decision-makers.

48

QUALIFIED LEADS / MONTH

₹920

COST PER LEAD

4x

LEAD VOLUME GROWTH

60 Days

TIMELINE

01 · CLIENT OVERVIEW

Who We Worked With

Velo is a B2B EdTech SaaS providing LMS and school management software to K–12 schools and coaching institutes across India. Series-A stage with a 4-person sales team. They were generating MRR but leaking heavily on acquisition — each qualified lead was costing far more than it should, and most leads weren't qualified at all.

02 · PROBLEM STATEMENT

What Wasn't Working

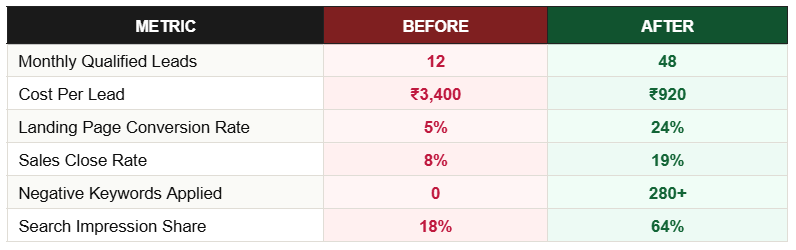
The Google Ads account was running broad-match keyword campaigns that were attracting students searching for study materials and tutoring — completely different from Velo's ICP of institute owners and school principals. Their landing page had no form above the fold, a generic 'Learn More' CTA, and a 5% conversion rate. Of 12 monthly leads, fewer than 4 would convert to demos.

03 · STRATEGY

How We Thought About It

Two parallel workstreams: account restructure and landing page rebuild. The core insight was that B2B buyers in EdTech need to see specific, outcome-led claims ('manage 500 students without a single spreadsheet') rather than feature lists. We restructured the campaigns to use exact and phrase match only, built ICP-specific landing pages per campaign, and connected CRM-qualified leads back to Google Smart Bidding as conversion signals.

In B2B Google Ads, message-to-market match is the primary lever. An institute owner looking for LMS software will click a generic ad — but they convert only when the landing page speaks exactly to their pain (manual fee collection, parent communication, attendance tracking). We built dedicated pages for each keyword theme with relevant outcomes front and centre.

04 · EXECUTION

Step-by-Step Breakdown

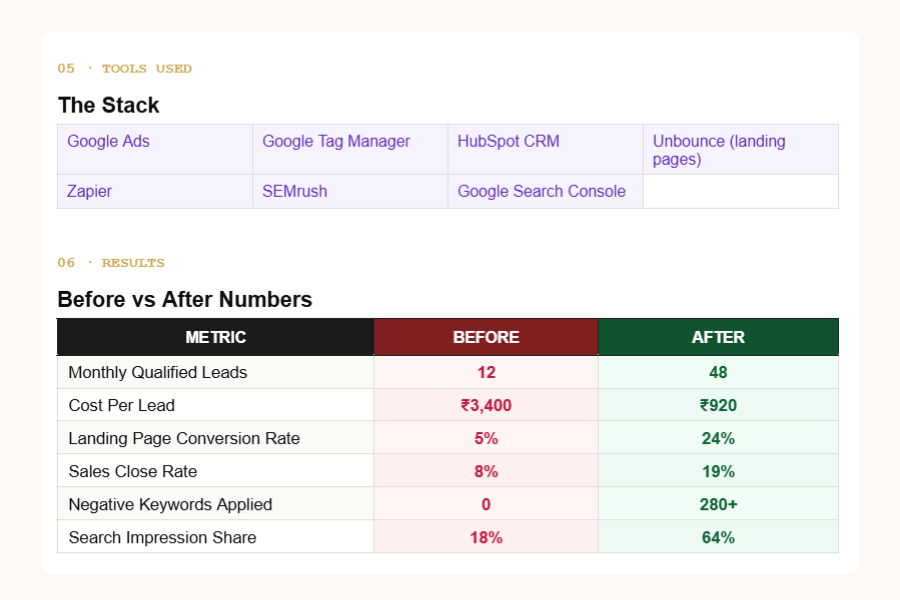
05 · TOOLS USED

The Stack

06 · RESULTS

Before vs After Numbers

Velo Results

◈ Portfolio Design Directions (For Behance / Designer)

07 · KEY TAKEAWAYS

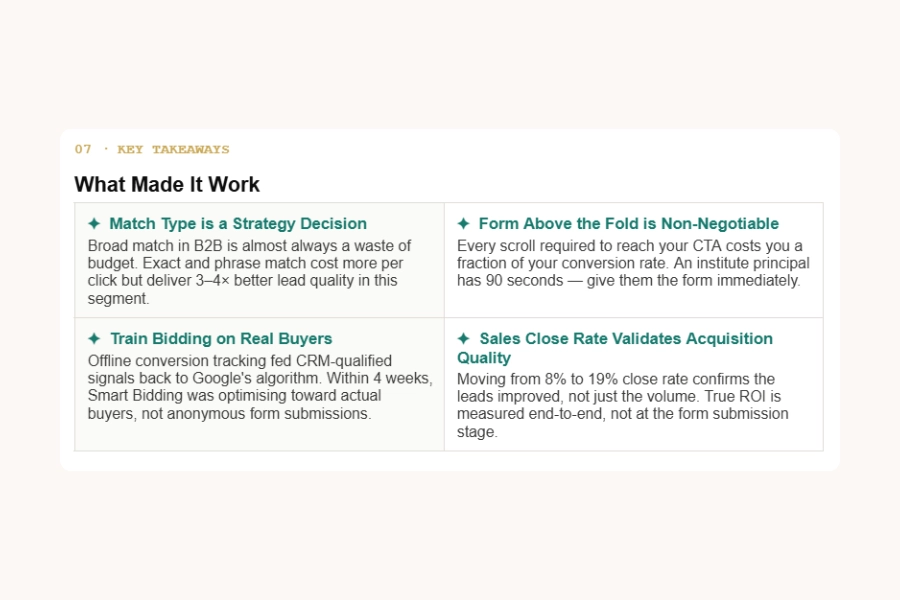
What Made It Work

Broad match in B2B is almost always a waste of budget. Exact and phrase match cost more per click but deliver 3–4× better lead quality in this segment.

Every scroll required to reach your CTA costs you a fraction of your conversion rate. An institute principal has 90 seconds — give them the form immediately.

Offline conversion tracking fed CRM-qualified signals back to Google's algorithm. Within 4 weeks, Smart Bidding was optimising toward actual buyers, not anonymous form submissions.

Moving from 8% to 19% close rate confirms the leads improved, not just the volume. True ROI is measured end-to-end, not at the form submission stage.

Screenshots

Want Results Like These?

Want us to rebuild your Google Ads account around qualified pipeline — not just traffic?

From Scroll to Sale: Rebuilding Lumis's Meta Engine

We stopped burning budget and started building a brand that actually pays for itself.

3.8x

ROAS

₹58L

PEAK REV / MONTH

−48%

COST PER ACQUISITION

11 Wks

TIMELINE

01 · CLIENT OVERVIEW

Who We Worked With

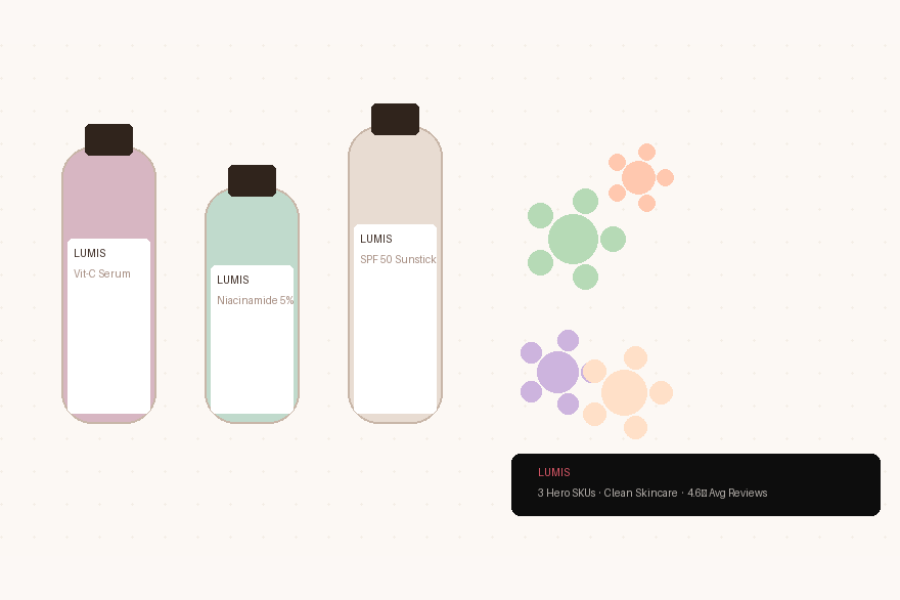
Nykora is a bootstrapped D2C skincare brand with three hero SKUs — a vitamin C serum, a niacinamide moisturiser, and an SPF sunstick — operating in the mass-premium segment. At two years old, they had strong product-market fit evidenced by 4.6-star reviews across 1,200+ orders. But they couldn't grow profitably past ₹22L/month despite steadily increasing Meta ad spend.

02 · PROBLEM STATEMENT

What Wasn't Working

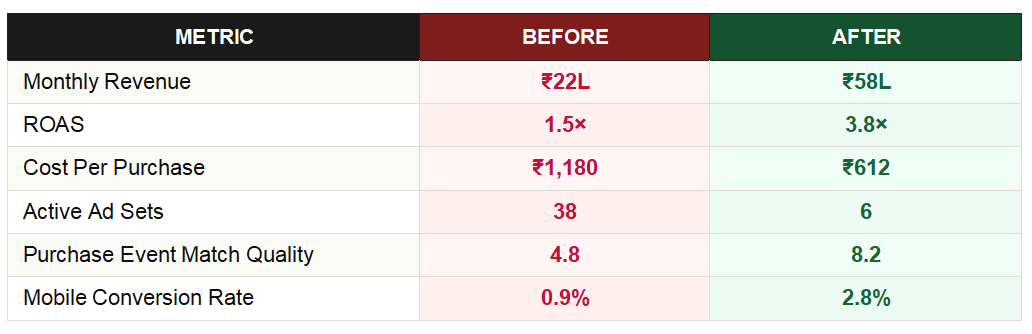
Nykora's Meta account was structurally broken before it was creatively weak. 38 ad sets ran simultaneously with no campaign organisation. Their Pixel had a purchase event misconfiguration — 40% of actual purchases went untracked. ROAS averaged 1.4–1.6×, below their breakeven of 2.2×. Every budget increase made losses worse, not better.

03 · STRATEGY

How We Thought About It

The diagnosis was structural before creative. Nykora had no working attribution, no campaign hierarchy, and no testing system. Our approach: restore tracking integrity first, then consolidate the account architecture so the algorithm receives clean signal, then build a UGC creative testing system. Scale only after all three foundations were in place.

The diagnosis was structural before creative. Nykora had no working attribution, no campaign hierarchy, and no testing system. Our approach: restore tracking integrity first, then consolidate the account architecture so the algorithm receives clean signal, then build a UGC creative testing system. Scale only after all three foundations were in place.

04 · EXECUTION

Step-by-Step Breakdown

05 · TOOLS USED

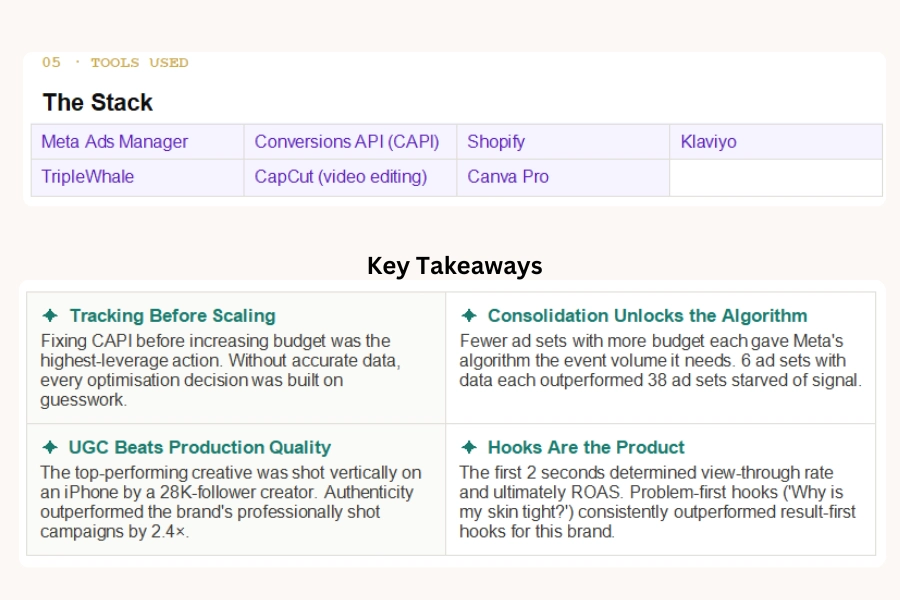
The Stack

06 · RESULTS

Before vs After Numbers

Lumis Results

◈ Portfolio Design Directions (For Behance / Designer)

07 · KEY TAKEAWAYS

What Made It Work

Fixing CAPI before increasing budget was the highest-leverage action. Without accurate data, every optimisation decision was built on guesswork.

Fewer ad sets with more budget each gave Meta's algorithm the event volume it needs. 6 ad sets with data each outperformed 38 ad sets starved of signal.

The top-performing creative was shot vertically on an iPhone by a 28K-follower creator. Authenticity outperformed the brand's professionally shot campaigns by 2.4×.

The first 2 seconds determined view-through rate and ultimately ROAS. Problem-first hooks ('Why is my skin tight?') consistently outperformed result-first hooks for this brand.

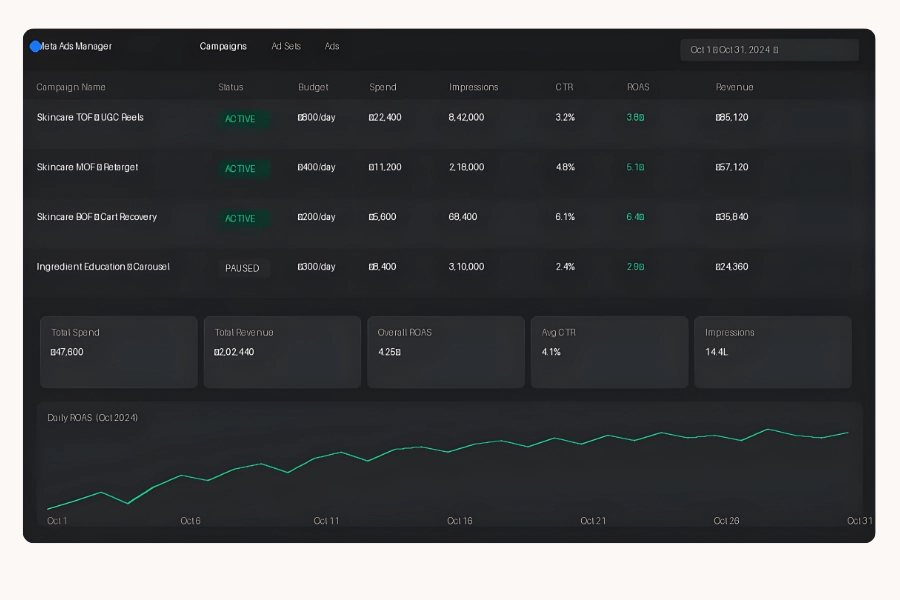
Screenshots

Want Results Like These?

Want us to audit your Meta account and rebuild it for profitable scale?